AnaylticsWithAlison_2568x1444 (2)

How often does the Kraken hold on to a lead? How many times have they scored the first goal? Do most of the games end in a certain score?

These are all questions that have popped to mind for many of us this season. These kinds of ponderings happen in any sport. But the answers aren't always easy to find. Until now.
Let's dig in.
On Monday, Micah Blake McCurdy

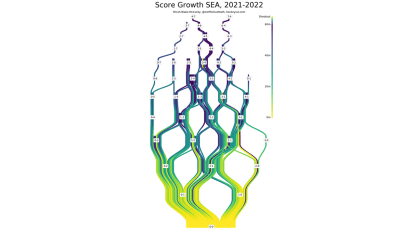
, HockeyViz.com. Aside from just being a lovely image, these viz trace the scoring for each game for an entire season and allow you to quickly identify trends that may exist or debunk theories you thought were true!
Let's take a look at the Kraken's Score Growth as of Jan. 31 and then we'll explore how to read it and what it means. (Link to Seattle's live image
HERE
).

Score Growth SEA

Each game is a tendril (or thread) that starts at the bottom and moves towards the top. Any time there is a scoring change, that is marked as such with the tally that we see on the scoreboard. (Seattle's score is always listed first).
For example, in the snippet of Seattle's viz below, we see that there have been four games thus far this season where the Kraken built up a 2-0 advantage.

1-1, 2-0

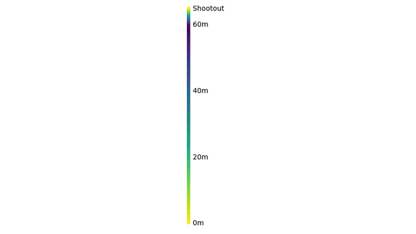
And Score Growth visuals don't just tell you the sequence of how scoring went down, they tell you when. The coloring of the lines relates to the time in the game when the scoring change happened. Yellow marks the start of the game, moving into greens and blues through the second period and finally into purples for the final 20 minutes. If there's extra time, the color scheme starts to reverse. All of this is explained in the handy legend on the right side of the image.

legend

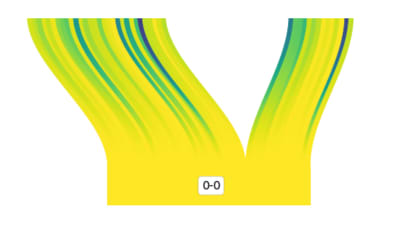
This also becomes more clear when you look at the "beginning" of Score Growth. Every game's start will be yellow and, obviously, with no score.

0-0

The width of the threads depends on how many games went on to the next possible score situation. It's like you're following the trail of a game, and this is where the fun starts. (Note: you can see trends for any team in any season going back to 2007-08).
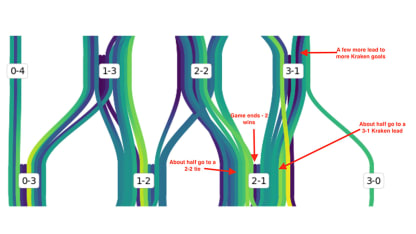
We can start to see things like, yes, the first goal has gone against the Kraken more often than not this year, but we also see that for a majority of play, Seattle is playing with a one goal differential on the scoreboard.
The Kraken are able to hold 2-1 leads a little bit more than half the time they build to them, and a 3-1 lead tends to be a good omen.

Score Growth

If you're like me, you're starting to scour the entire image to see what happens going into a certain score state and what comes after. And even as you realize all that this visual can tell us, there are probably a lot more questions that come to mind.
To that end, it's important to note that these visuals are descriptive ONLY, meaning that they don't have any "obvious team evaluation value" right now, as McCurdy said on Monday.
But ultimately, knowing that this resource exists to help us answer a specific group of queries is still pretty cool.
It's the perfect example of the saying, "a picture is worth a thousand words."