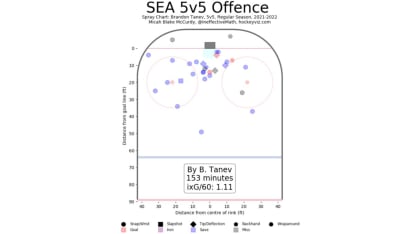
xG can measure what a player creates through their shot attempts, but what about what's going on for the entire team when any one player is on the ice? xG can measure that, too. In addition to Evolving-Hockey.com, other sites that track xG include NaturalStatTrick.com, MoneyPuck.com, and HockeyViz.com. These sites will calculate how much shot quality does a player's team generate when that specific player is on the ice (Expected Goals For, xGF, higher is better) as well as how much shot quality does an opponent generate when said player is on the ice (Expected Goals Against, xGA, lower is better). So now we can see if a player is helping drive play for his team and/or if a player is limiting quality chances against.
If you want to look at xG in isolation, again we can look at totals like we did for individual players but you may also see xG presented as a rated, or "per 60" stat, which basically accounts for how much ice time a player has in relation to what they contributed. Think of any per 60 stat as "leveling the playing field" and adjusting for the differences in ice time among players.
Another great way to consider both quality for and against together is to look at the overall percentage of shot quality generated. If a player has an xGF% of more than 50%, that means they are helping create an offensive advantage for their team as measured by shot quality. Haydn Fleury leads the Kraken in this measure with a 61.9 xGF% (that's also 32nd in the NHL).
What does a prime example of impacting team performance look like? Let's look at Jordan Eberle's hat trick performance against Buffalo. Yes, the goals were fantastic, but also, the shot chart below shows shot attempts for both teams from that game when Eberle was on the ice.


